In 2023 every new tool or service was poor if it didn’t use AI to rich it’s goal. We’ve seen rise of AI tools that can draw jaw-dropping scenery, craft catchy rock songs, write beautiful blog posts, or create corporate logo for you. In today’s blog post we will talk about service that helps create design for your data project. It’s called Visily. Creators describe it as an AI-powered UI design software. This SaaS allows you to create designs for websites and applications. It’s functionality covers several Use Cases: from Brainstorming and Prototyping to Wireframing and Team Collaboration. We will analyze this service from Business Intelligence Developer’s perspective.
For BI developers there are 4 main pillars of creating good looking report:
- 1. Cleaning and understanding data
- 2. Modeling data
- 3. Creating Calculations (e.g. calculated measures)
- 4. Design
In Business Intelligence there is a term “Storytelling”. The last topic from above list is exactly about storytelling. It becomes often most complex, because Target Groups of BI reports are normally Business Users, not developers or other people with technical focus. So how to design reports that contain all the necessary information from one hand and are easily readable for Business Users from the other hand? How can we “guide” those users through numbers and figures? BI developers always splitting between choosing simple table or matrix, pie or doughnut chart, choosing the right font and it’s size. Sometimes data can be ok but design lack makes report nearly impossible to use.
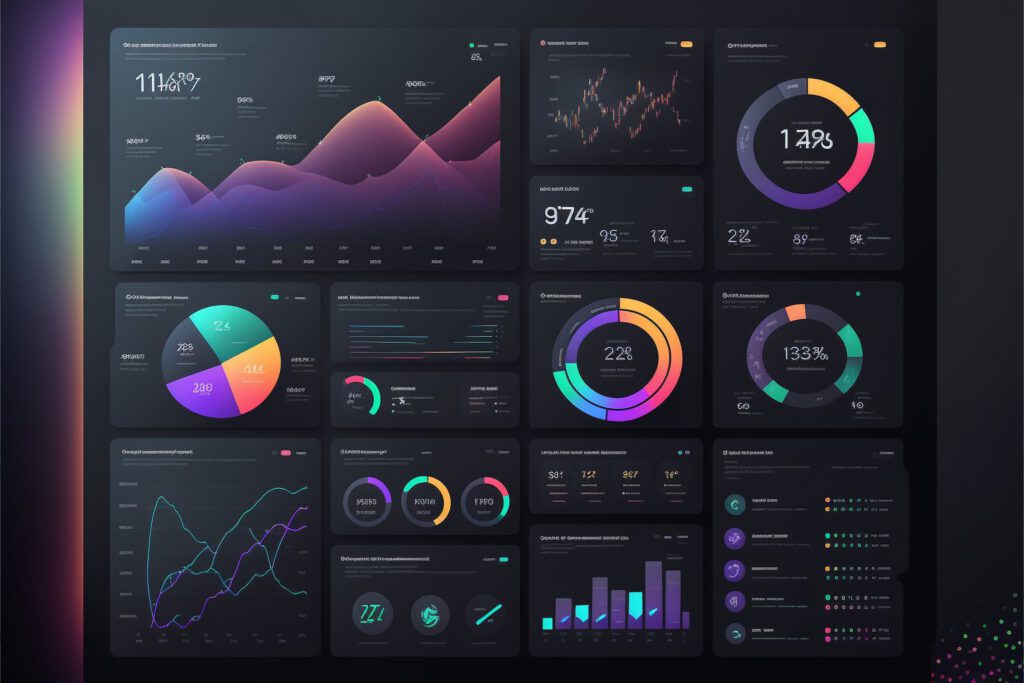
As a developer I often had that dilemma: invent design by myself or just check internet and “steal”. The job became easier when I found Midjourney bot which can draw some blurry and not perfect designs, but I get inspired and use some details and create quite cool designs.
But if we want to create clean designs ourself, this is when Visily comes into play. It can do 4 main things: Brainstorming, Wireframing, prototyping and collaboration.
Using this service you can create mockups for websites, applications, mind map, diagrams, dashboard and many more. It offers a range of variety elements, thousands of templates, icons which you can use to build your project.

On a clean, simple canvas you can drag and drop simple objects, resize, color, replace ,delete and add again and eventually build mockup that you would like to use. You can share it live with client or coworkers and they can add their own ideas. In live mode you can discuss with others whether use column chart or line chart. Then you can easily organize your created designs into different folders.
OK, Visily is greate service, but… What about AI?
So what makes this service and why it is AI? Because it can convert your screenshots and hand drawn sketches into editable wireframes! It also can convert text. You just need to scan your hand drawn sketches and AI will automatically recognize its design and prepare for you file and you can start editing it with your coworkers.
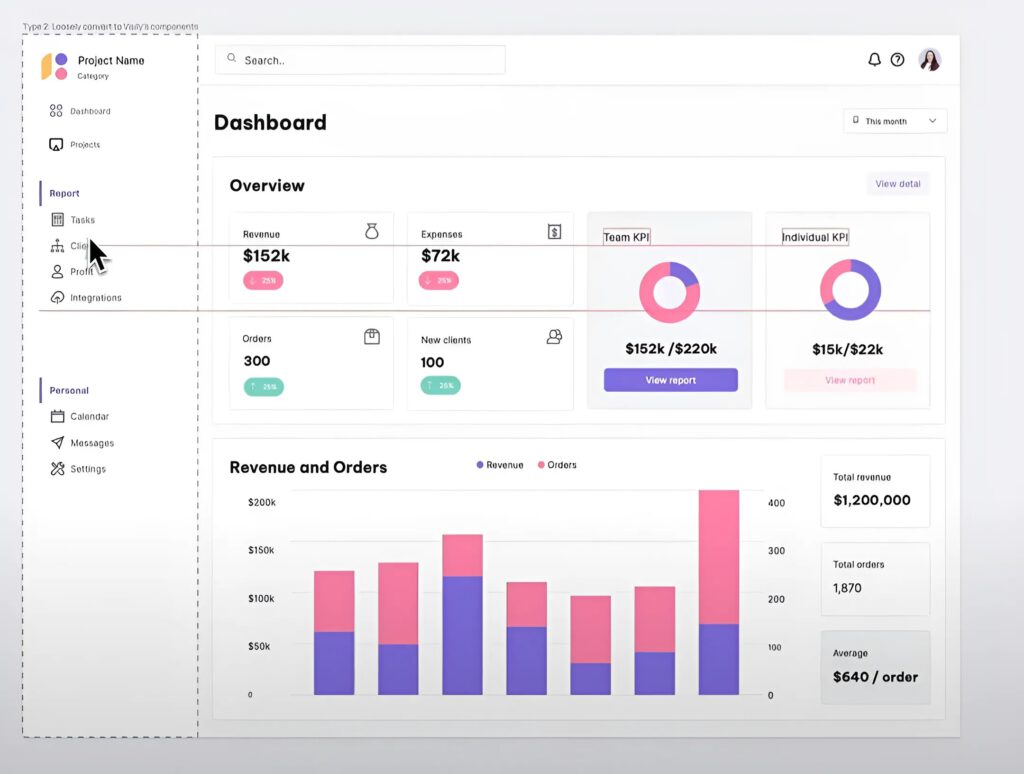
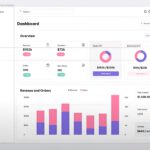
It has proved itself particularly useful by improving existing dashboards: You make screenshot of existing layout and upload in Visily. AI does the rest of the job: You get an editable layout you can work with and edit e.g. Texts/Titles separate elements directly. It saves a lot of time and effort! I tested and it works fine without any issues, is fast and you really have fun doing it!
Any app or website screenshot would do! Here are some ideas:
- – Screenshots from an existing app or website you want to improve its UI
- – Screenshots downloaded from Mobbin, Behance, Dribbble, and Google
- – Screen images exported from Figma, XD, Sketch etc.
Colclusion
In conclusion, I highly recommend this service to designers, analysts, programmers and IT professionals. I really wait for my next data analytics project to use this tool and create my own design or again user some other screen. And the most pleasant part: This service is completely FREE! Enjoy!